Station Data versus Spatial Data
Unlike the other showcases, this one does not address a specific issue, but rather lists options for which data sets should be preferred for obtaining information.
Measurement data vs. gridded data sets
The GeoSphere Austria data portal offers both measurement data from weather stations and data that has been further processed into grid data sets. The difference between these two types is outlined briefly below.
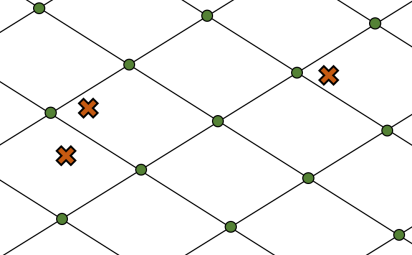
Measurement data is derived from measurements taken at various measuring stations after data verification. Their irregular distribution is subject to continuous fluctuation, as stations can be relocated, dissolved, or newly established. An overview of the Austrian station network can be found at: https://geosphere.at/de/karten/aktuelles-wetter . In the accompanying Figure 1, measurement data is symbolized by the orange “X” marks.
In contrast, as the name suggests, there is data that is arranged in a regular grid (green dots in Figure 1) and is available from each of these grid points. The resolution and parameters vary from data set to data set. To create these data sets, multiple pieces of information can be taken into account at the same time, but this is not mandatory. In addition to measured values, topographical data, satellite observations, data from past calculated weather forecasts, or data from precipitation radars are also suitable for this purpose.
Whether measured values or grid data sets are more suitable for answering a question varies greatly from case to case. It should be noted that station data may provide data from parameters or at times that are not covered by grid data sets. On the other hand, grid data sets represent sources of information for regions where no measurement data is available in the immediate vicinity at the time of the query.