Alpine pumping in the Inn Valley
Alpine pumping is a diurnal alpine meteorological wind system that causes an inflow phase during the day and an outflow phase at night. This phenomenon is most intense on days and nights with weak gradients (only light winds due to synoptic low- and high-pressure areas) and little cloud cover.
Case study from the Inn Valley
This first section presents a case study of alpine pumping from the Inn Valley. March 30, 2021 was selected for this purpose. Upon reviewing current weather maps, this date proved to be a potential candidate for a day with alpine pumping.
At altitude, a wedge over Central Europe dominates this Monday, bringing with it sinking movements, which means that only light cloud cover is to be expected. The high-pressure influence also prevails at ground level and shows hardly any pressure gradient. The two prerequisites for alpine pumping, 1) weak gradient and 2) low cloud cover, should therefore be met. Measurements confirm this assumption: at Patscherkofel (2251 m), the strongest wind gust was just 22 km/h, and the duration of sunshine in Innsbruck was around 11.5 hours.
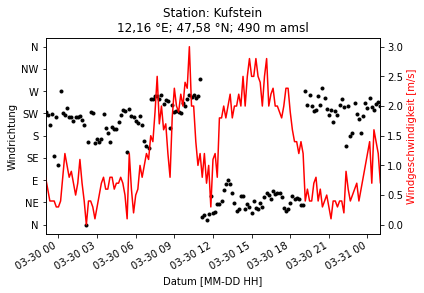
Figure 1.1 below shows wind direction and speed for March 30, 2021, at the Kufstein station, which is located in the lower Inn Valley. The Inn Valley is oriented SW-NE, which means that, according to the Alpine pumping concept, these should also be the wind directions during the inflow and outflow phases. The evaluation shows this behavior in an exemplary manner, as the outflow of inner-Alpine air masses at night and in the early morning hours is characterized by wind directions from SW to W. Around 11 a.m., the wind suddenly shifts by almost 180° to northeast – the inflow phase has begun. It lasts until another sudden change in wind direction at around 7 p.m., when the wind starts blowing from south to west again. The wind speed decreases significantly at the turning points. On average, the wind was weaker during the outflow phase than during the inflow phase.
Data and evaluation software used
The 10-minute measurement data was used for the evaluation just presented. This data was downloaded as a .csv file and evaluated and displayed using the Python 3 programming language. A similar evaluation is also possible with other programs such as Microsoft Excel.
Appendix / Images
Wind averaging
From the case study presented in step 1, we will now move on to creating statistics. Data from 2016 to 2020 will be used for this purpose. However, since a resolution of 10 minutes and a duration of 5 years would result in a data volume to large to download collectively from the data portal, the temporal resolution is reduced to hourly data. Alternatively, the 10-minute data could also be partially obtained and then manually combined.
The evaluation
The transition point between the inflow and outflow phases is not at the same time every day and depends on many factors such as the season (sun position) and local weather conditions such as fog. Therefore, the phases are now defined in such a way that the transition point is very unlikely to fall within the selected time period.
- The nighttime outflow phase: 21 UTC to 05 UTC
- The daytime inflow phase: 10 UTC to 18 UTC
Within these times, over the duration of the 5 years mentioned, every hourly value (including the boundaries of the intervals) is taken into account.
The results
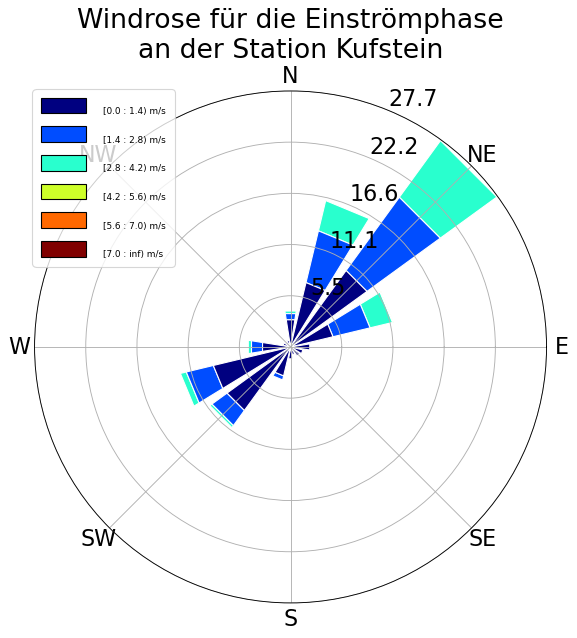
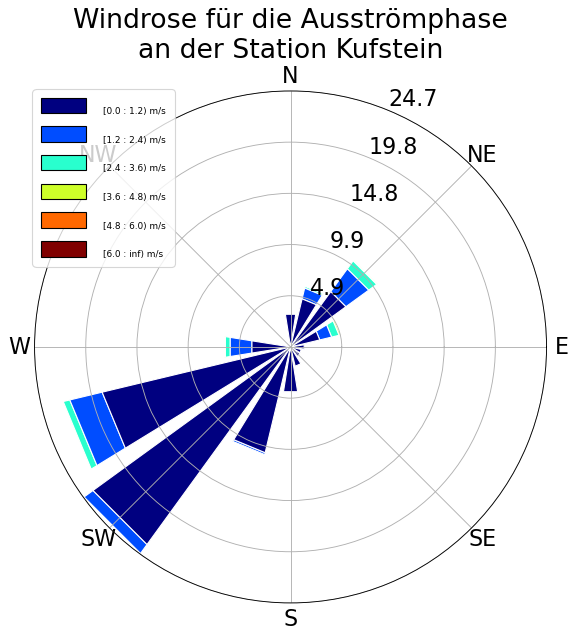
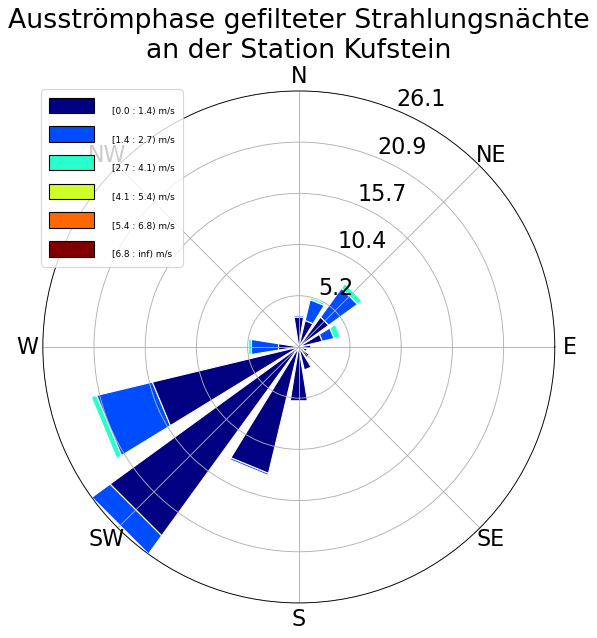
The measurement data for wind direction and wind strength obtained in this way are now displayed in a wind rose (Figure 2.1 and Figure 2.2). After filtering out a few erroneous values, 16,392 time points were used for the inflow phase and 16,389 measurement points for the outflow phase.
Explanation of illustrations: The wind roses contain information on the frequency and magnitude of wind at the Kufstein station in the pre-filtered time interval with a certain strength from a certain direction. Each color represents a defined velocity interval. Care must be taken when comparing two wind roses, as the coloring is not standardized but adapts to the respective data. The length and direction of each segment indicates how often the wind blew from/at this direction/speed. If a segment begins with a new color outside of a color, the number counts from this color change, not from the center. The numbers in the upper right quadrant represent the frequency given as percentage at this distance from the center. These illustrations were also created with Python 3 using the “windrose” package.
Interpretation of the results
The wind roses confirm what the case study mentioned at the beginning already suggested: in well over half of the cases, the wind direction is southwest/northeast during the outflow/inflow phase respectively. Although the color scales between the two wind roses are not exactly the same, it can be seen that the magnitude is larger on average during the inflow phase than during the outflow phase. It also becomes clear that wind direction perpendicular to the valley floor is an exception. Most of the time, the wind direction in Kufstein is parallel to the Inn Valley.
In this evaluation, the hours determined at the beginning were evaluated for each day. In a final step, these will be filtered in stage 3 according to days on which alpine pumping is to be expected.
Appendix / Images
Additional filtering based on cloud cover and high-altitude winds
Instead of considering every value from 5 years, high-altitude winds and cloud cover are now used to filter days and nights that show a high potential for alpine pumping. The filtering is based on the following threshold values:
- Cloud cover: On average ≤ 4/8
- High-altitude winds: Never stronger than 60 km/h on the Patscherkofel
If a period meets these conditions, it is included in this evaluation. The SYNOP reports from the Innsbruck Airport station are used to calculate the average cloud cover, and the arithmetic mean is derived for all cloud cover obervations within an inflow or outflow phase. After this filtering, and filtering for high winds using the Patscherkofel station, 507 inflow and 513 outflow phases remain for evaluation. These days and nights contain 4552 and 4607 measured values, respectively.
The results
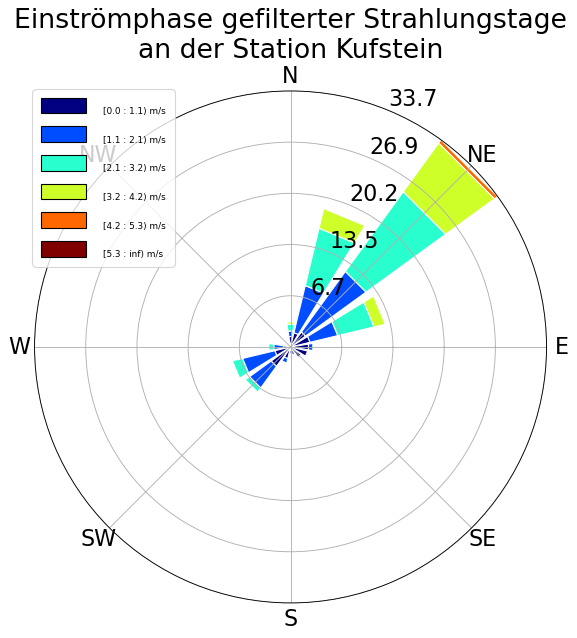
This additional filtering was again performed using the Python 3 programming language. Figures 3.1 and 3.2 below show the wind roses that were also created using this method. These should be interpreted in the same way as those in step 2, although attention should be paid to the different color scheme.
Compared to the wind roses presented earlier, the phases are even more clearly visible. However, there are still “outliers” where the wind direction does not follow the concept of alpine pumping. These exceptions may be attributed, for example, to small-scale weather phenomena such as thunderstorms or showers. Sunny spring or summer days with little cloud cover are particularly conducive to the formation of convective events. In general, however, Alpine pumping was already very evident before filtering through the distinctive cross-section of the Inn Valley, which means that the gain from filtering is smaller.
Appendix / Images
Datasets
In diesem Datensatz sind tageweise jeweils 24 Stundenwerte eines bestimmten Parameters dargestellt. Je nach Parameter kann es sich beim Stundenwert um einen Momentanwert zur vollen Stunde, einen Mittelwert über die letzte Stunde, einen Extremwert...
Temperature, Humidity, Radiation, Wind, Precipitation, Cloud cover, Pressure, Snow, Sunshine

Dieser Datensatz beinhaltet Messdaten von 1992 bis heute in 10 minütiger Auflösung. Die Wetterstationen der GeoSphere Austria bilden das einzige umfassende meteorologische Messnetz in Österreich. Sie stellen das Rückgrat von Wettervorhersage,...
Temperature, Humidity, Radiation, Wind, Precipitation, Cloud cover, Pressure, Snow, Sunshine